Cardiology and ECG – Quick and Dirty Reference
Category: Cardiology
Topic: Quick and Dirty Guides to Cardiology
Level: AEMT
Next Unit: The Quick and Dirty Guide to Cardiology I
21 minute read
ECG Cheat Sheet
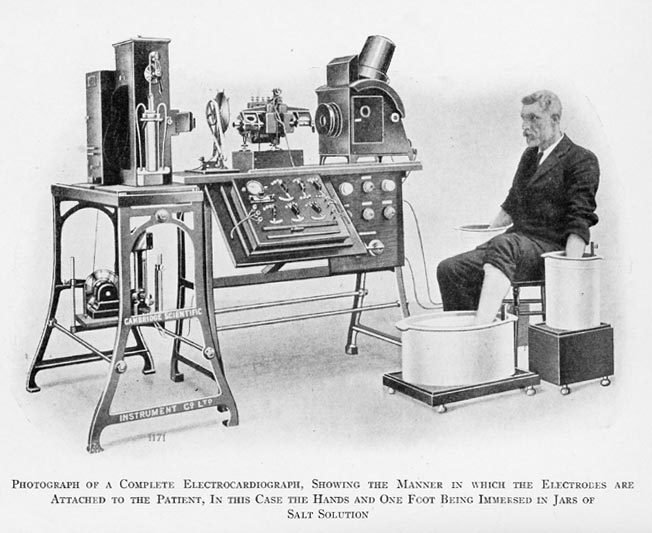
An EKG is NOTHING MORE than a voltmeter with an oscilloscope (screen.)
UNDERSTANDING A STRIP
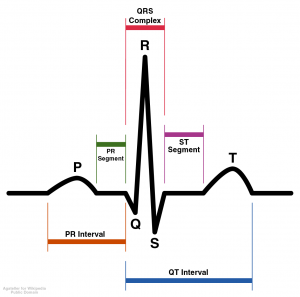
P Waves - Atrial Depolarization
QRS Complex – Ventricular Depolarization
T Wave – Re-polarization of Ventricles
U Wave – Re-polarization of Purkinje Fibres
PR Interval – Measurement from the beginning of the P wave to the beginning of QRS. A reference point for blocks.
QT Interval – Beginning of QRS Complex to end of T wave – Absolute Refractory Period is the beginning of QRS to PEAK of T wave. The last half of T-wave is known as relative refractory period.
Q Waves
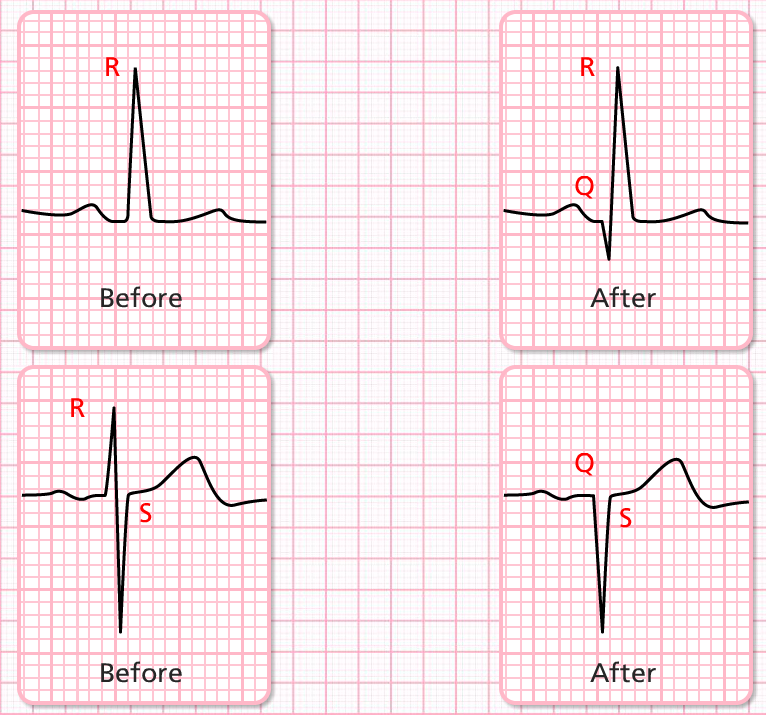
- A normal Q wave is 2m wide by 2m deep.
- A pathological Q wave is any Q wave is greater than 2×2 or greater than 1/3 height of R wave.
- Physiologic Q waves represent depolarization of the septum
- Pathological Q waves represent depolarization of the septum around a previously damaged portion of the septum.
ST-Segment 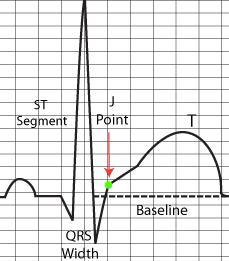
- Deviation off of the isoelectric line after the J point.
- At J point, sodium and potassium levels are equal inside and outside the cell. Then the Na-K+ starts pumping K+ into the cell at the rate of 3 sodium ions per 2 K+ ions until they are re-polarized.
- At the relative refractory period, about half of the cells are depolarized and the right amount of electricity at the right time can induce re-polarization. If shocked in RRP, he likely goes into VTach or VFib.
- At the end of depolarization, when charges are equal, the sodium K+ pump will try to kick in, but because it's starved of oxygen, the ventricles will be hyper-polarized and take longer to get the potassium in… so your ST Segment is higher until the K+ gets moving. Sometimes the cells will die.
- To measure ST elevation, measure from 1 little box to the right of the J point.
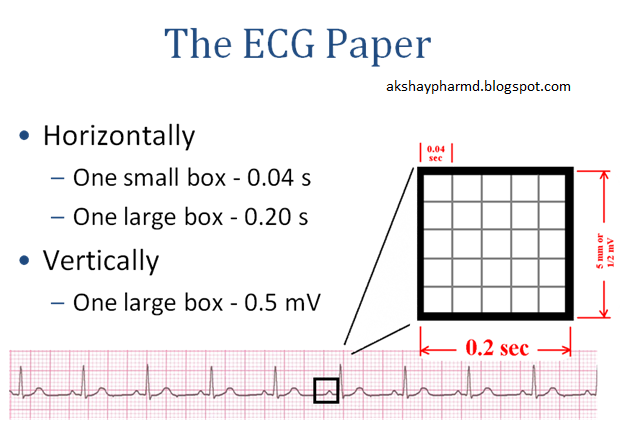
Converting seconds to milliseconds… move decimal to the right 3 places
.12 seconds = 120ms
.08 seconds = 80ms
.2 s = 200 – ms
350-450ms standard QT interval
Lead Placement
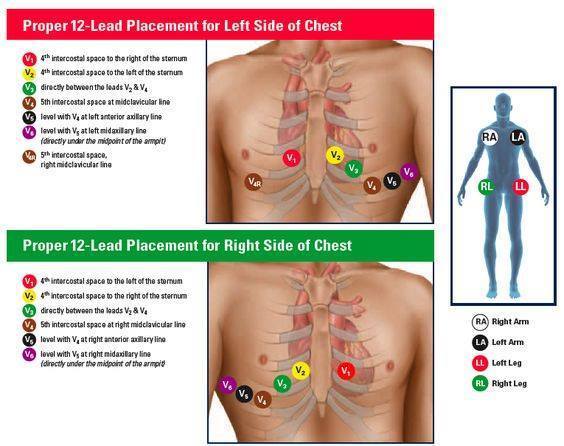
Electrode label (in the USA) Electrode placement
RA On the right arm, avoiding bony prominences.
LA In the same location that RA was placed, but on the left arm this time.
RL On the right leg, avoiding bony prominences.
LL In the same location that RL was placed, but on the left leg this time.
V1 In the fourth intercostal space (between ribs 4 & 5) just to the right of the sternum (breastbone).
V2 In the fourth intercostal space (between ribs 4 & 5) just to the left of the sternum.
V3 Between leads V2 and V4.
V4 In the fifth intercostal space (between ribs 5 & 6) in the mid-clavicular line (the imaginary line that extends down from the midpoint of the clavicle (collarbone).
V5 Horizontally even with V4, but in the anterior axillary line. (The anterior axillary line is the imaginary line that runs down from the point midway between the middle of the clavicle and the lateral end of the clavicle; the lateral end of the collarbone is the end closer to the arm.)
V6 Horizontally even with V4 and V5 in the midaxillary line. (The midaxillary line is the imaginary line that extends down from the middle of the patient’s armpit.)
Limb leads – 1 RA-LA
Einthoven’s triangle… lead 1 2 3
Augmented limb leads are calculated combination leads of the limb leads. (av junction is the center of the augmented limb leads.)
AVL is a combination of lead 1 and 3.
AVF is a combination of lead 2 and 3.
Augmented Ventricular Left – AVL
Augmented Ventricular Right – AVR
Augmented Ventricular Foot – AVF
Limb leads 1,2,3 all are frontal plane leads
Augmented leads are all frontal plane leads b/c they are augmented limb leads
Horizontal plane leads – separates ventricles at the level of the AV node
Everything above the AV node is anterior
Everything below the AV node is inferior
(12 lead is specific to the left ventricle only)
R Wave Progression
- V1 R wave should be mostly negative
- V6 R wave should be mostly positive
- The transition from most negative to most positive R waves should be seen through leads 3-4. If it happens in 2, he has “early” R-wave progression. If it's more toward 5, its called “late or poor” R wave progression could be caused by ischemia or damage.
- Whenever you start looking at V leads, you should first look at R wave progression.
Frontal Plane Vectors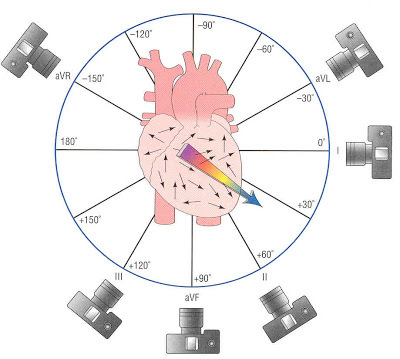
Directly lateral to AV node and to the left is V1. (180 degrees)
lead 2. (0 degrees)
aVF is directly perpendicular to lead 1 and is (90 Degrees)
Lead 3 is 120 degrees
aVL is above lead 1 at -30 degrees
AVR is above and to right at -150 degrees (impulses move backwards, as in Vtach)
aVF straight down at the umbilicus (90 degrees)
V leads are unipolar, always positive, v2 and v3 always windows looking at the septum, 3,4, looking at more lateral, 5,6 most lateral.
Posterior inferior side of the left ventricle. 2, 3, aVF = (Inferior leads)
lead V1, V2 both look at septum (Septal leads)
lead V3 and V4 look at the thick muscular wall of the anterior (anterior leads)
Lead v5, v6, lead 1, and aVL all look at the lateral portion of the left ventricle (lateral leads)
(v5 and v6 look at low lateral) (lead 1 and aVL look at high lateral)
Axis – direction of energy flow
divided into 4 quadrants
If it flows to upper left, then its left axis deviation
If it flows to lower left, then its normal axis
If it flows to lower right then its right axis deviation
If it flows to upper right, then its extreme right axis deviation (ERAD)
Estimating QRS Axis
Lead 1 and aVF – the QRS are normally upright. Normal Axis.
If 1 is positive and aVF is mostly negative, energy is flowing more towards the 1 lead – left axis deviation.
if 1 is mostly negative and aVF is mostly positive, then it's moving away from 1 and toward aVF so you might have a right axis deviation.
What You Should See On A 12 Lead
- All waves upright except aVR
- Small Q waves in lateral leads
- All T waves smooth and gradual
- T wave- positive negative or biphasic in v2 positive in v2-v6
- V1 small R, deeper S
- V6 tall R small S
- Transition in v3-4
Myocardial Infarction: Recognition and Localization
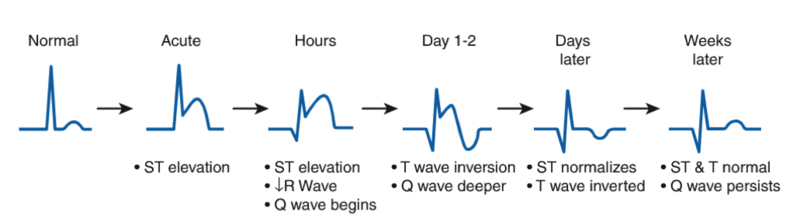
ST Depression = Ischemia – lack of blood flow
ST Elevation = Injury – damage caused by continued hypoxia (will heal; is reversible)
Pathologic Q waves = Infarction: Tissue death from prolonged hypoxia (irreversible)
Pathologic Q waves AND ST elevation in the same lead, he is actively killing muscle tissue.
Subendocardial MI – zone of infarction is the only partial thickness of myocardium: New Term: Non-Q wave MI (doesn’t produce pathologic Q wave)
Transmural MI - complete thickness of the wall is infarcted: New term: Q-Wave MI
LCA goes into LAD and LCx
The lad feeds the left ventricle. Diagonals off of the LAD feed the septum. LCx feeds the lateral side.
Right coronary artery (marginal branch – big one on the anterolateral surface of the right ventricle.)
divides at the posterior descending RCA and distal RCA) both feed the inferior portion of the left ventricle.)
Anterior, Septal, lateral problems tend to be LCA issues.
Right ventricular and inferior left ventricular tend to be RCA issues.
The ONLY time you will see ST Elevation in Left and Right sides are in Apical MIs.... and Pericarditis.